Introduction to Data Reuse, Access and Provenance
Overview
Teaching: 5 min
Exercises: 0 minQuestions
What will be covered in this section
Objectives
Practice best practices for manipulating and analyzing data. Learn what to look for in metadata to make sure a dataset is ready for analysis.
What we will cover in Part II:
- How to assess a dataset to make sure it is ready for analysis.
- Access and download a dataset from BCO-DMO.
- Learn the benefits and drawbacks to analyzing data in spreadsheets.
- Walkthrough data access and plotting to learn about document provenance.
- Learn about other ways to analyze data other than spreadsheets.
Introduction
Spreadsheets are good for data entry, but in reality we tend to use spreadsheet programs for much more than data entry. We use them to create data tables for publications, to generate summary statistics, and make figures.
Why is data analysis in spreadsheets challenging?
-
Data analysis in spreadsheets usually requires a lot of manual work. If you want to change a parameter or run an analysis with a new dataset, you usually have to redo everything by hand.
-
It is also difficult to track or reproduce statistical or plotting analyses done in spreadsheet programs when you want to go back to your work or someone asks for details of your analysis. It can be very difficult, if not impossible, to replicate your steps, particularly if your stats or figures require you to do more complex calculation.
-
Generating tables for publications in a spreadsheet is not optimal - often, when formatting a data table for publication, we’re reporting key summary statistics in a way that is not really meant to be read as data, and often involves special formatting (merging cells, creating borders, making it pretty). We advise you to do this sort of operation within your document editing software.
Using Spreadsheets for Data Entry and Cleaning
However, there are circumstances where you might want to use a spreadsheet program to produce “quick and dirty” calculations or figures, and data cleaning will help you use some of these features. Data cleaning also puts your data in a better format prior to importation into a statistical analysis program. We will show you how to use some features of spreadsheet programs to check your data quality along the way and produce preliminary summary statistics.
What this lesson will not teach you
- How to do more advanced statistics in a spreadsheet
- How to write code in spreadsheet programs
If you’re looking to do this, a good reference is Head First Excel, published by O’Reilly.
Background: What is a CTD?
CTD stands for conductivity, temperature, and depth, and refers to a package of electronic instruments that measure these properties (see more about CTDs at https://oceanexplorer.noaa.gov/facts/ctd.html

CTDs can be moored and collect data while they are stationary. They can also be lowered and raised in the water column to create profiles of the water column.
Background: What are Niskin Bottles?
A Niskin bottle is a plastic cylinder with stoppers at each end in order to seal the bottle completely. This device is used to take water samples at a desired depth without the danger of mixing with water from other depths. The water collected by Niskin bottles can be used for studying plankton or measuring the physical characteristics of the sea. Niskin bottles are often either set up in a series of individual bottles or they are set up in a carrousel, together with a CTD instrument. (Source Flanders Marine Institute: https://www.vliz.be/en/Niskinbottle)
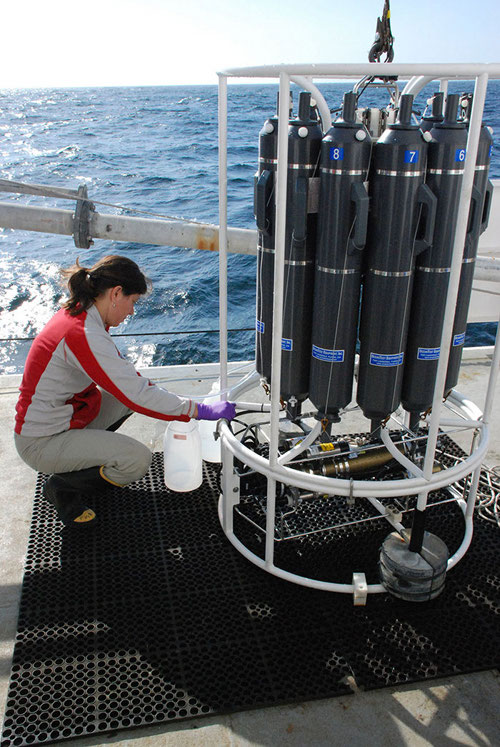
The data that we will use in the next chapters will be the BATS CTD and Niskin bottle datasets that BCO-DMO is hosting.
Key Points
Data Analyisis in Spreadsheets is Challenging
Assessing Datasets for Reuse
Overview
Teaching: 15 min
Exercises: 10 minQuestions
How do you assess datasets to make sure they are ready for analyses?
How do you download the dataset you choose?
How do you plot and explore data?”
Objectives
Practice best practices for manipulating and analyzing data. Learn what to look for in metadata to make sure a dataset is ready for analysis.
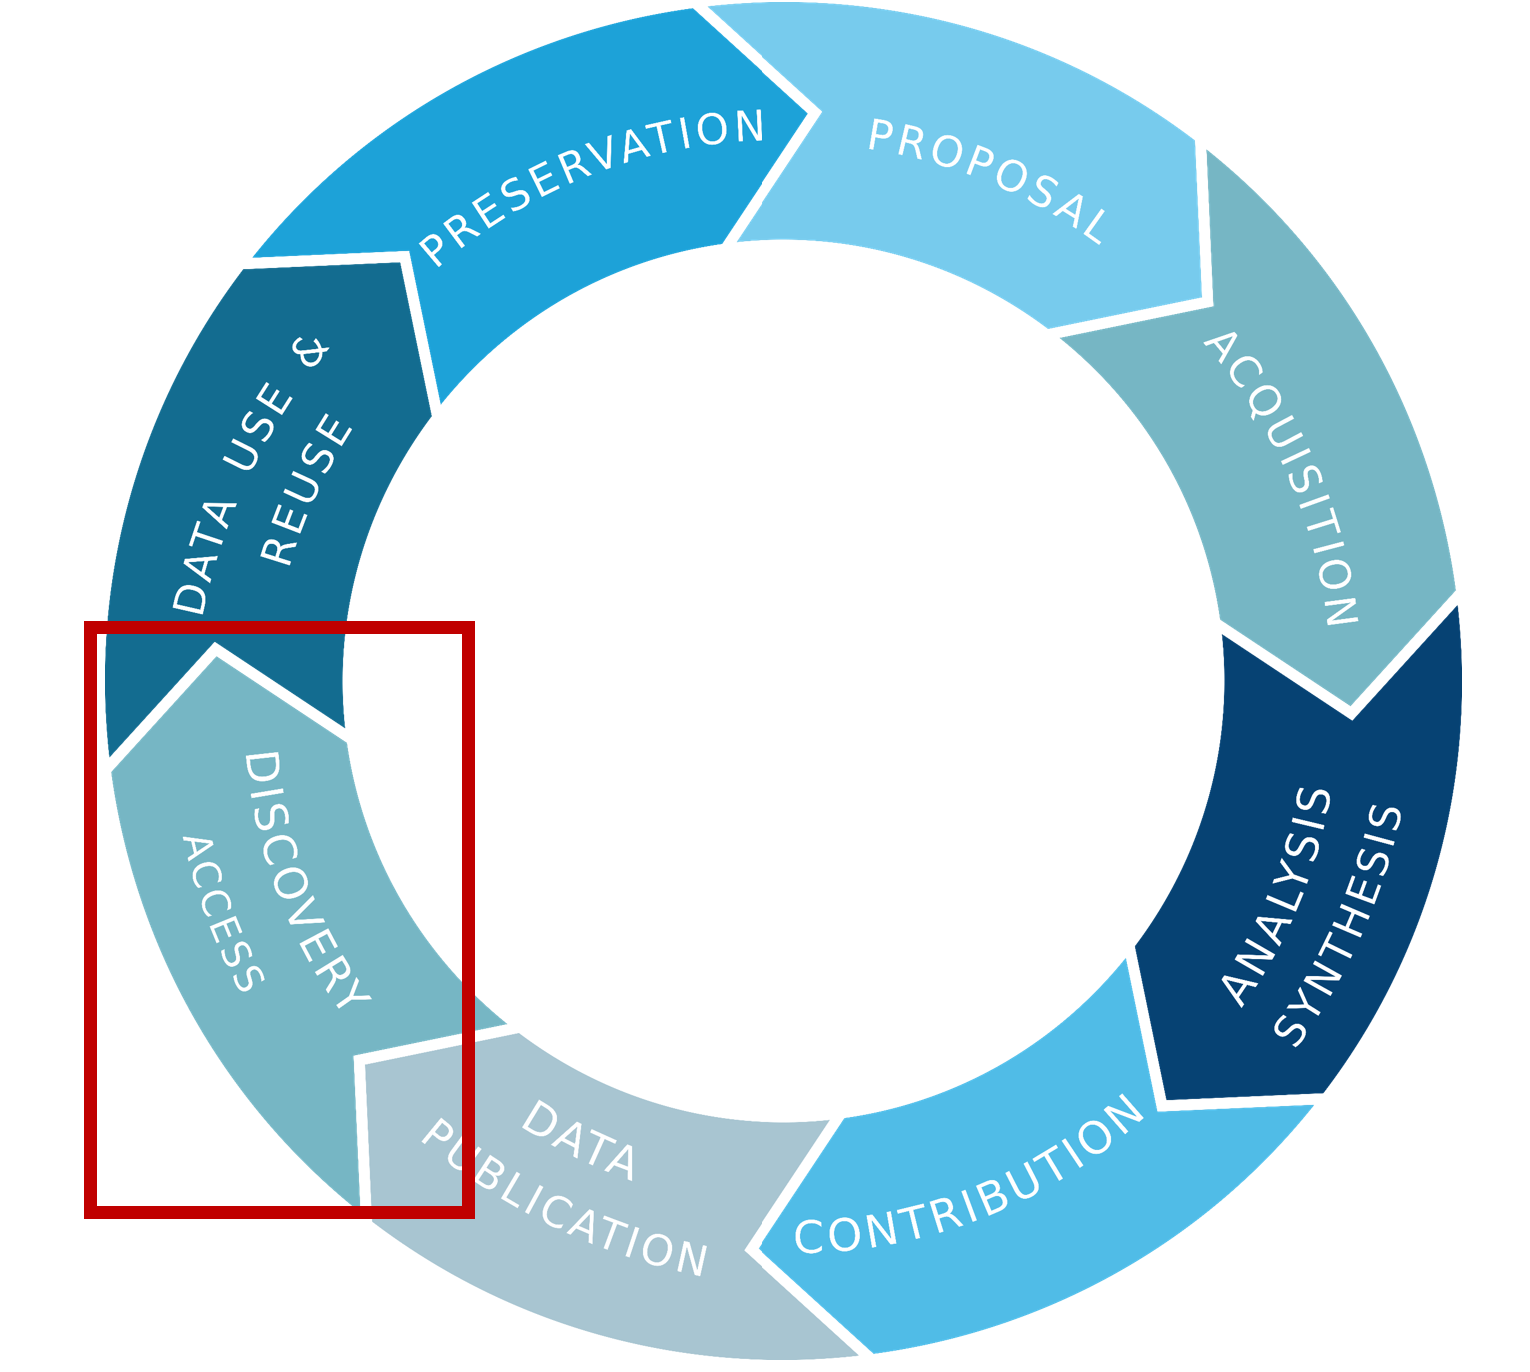
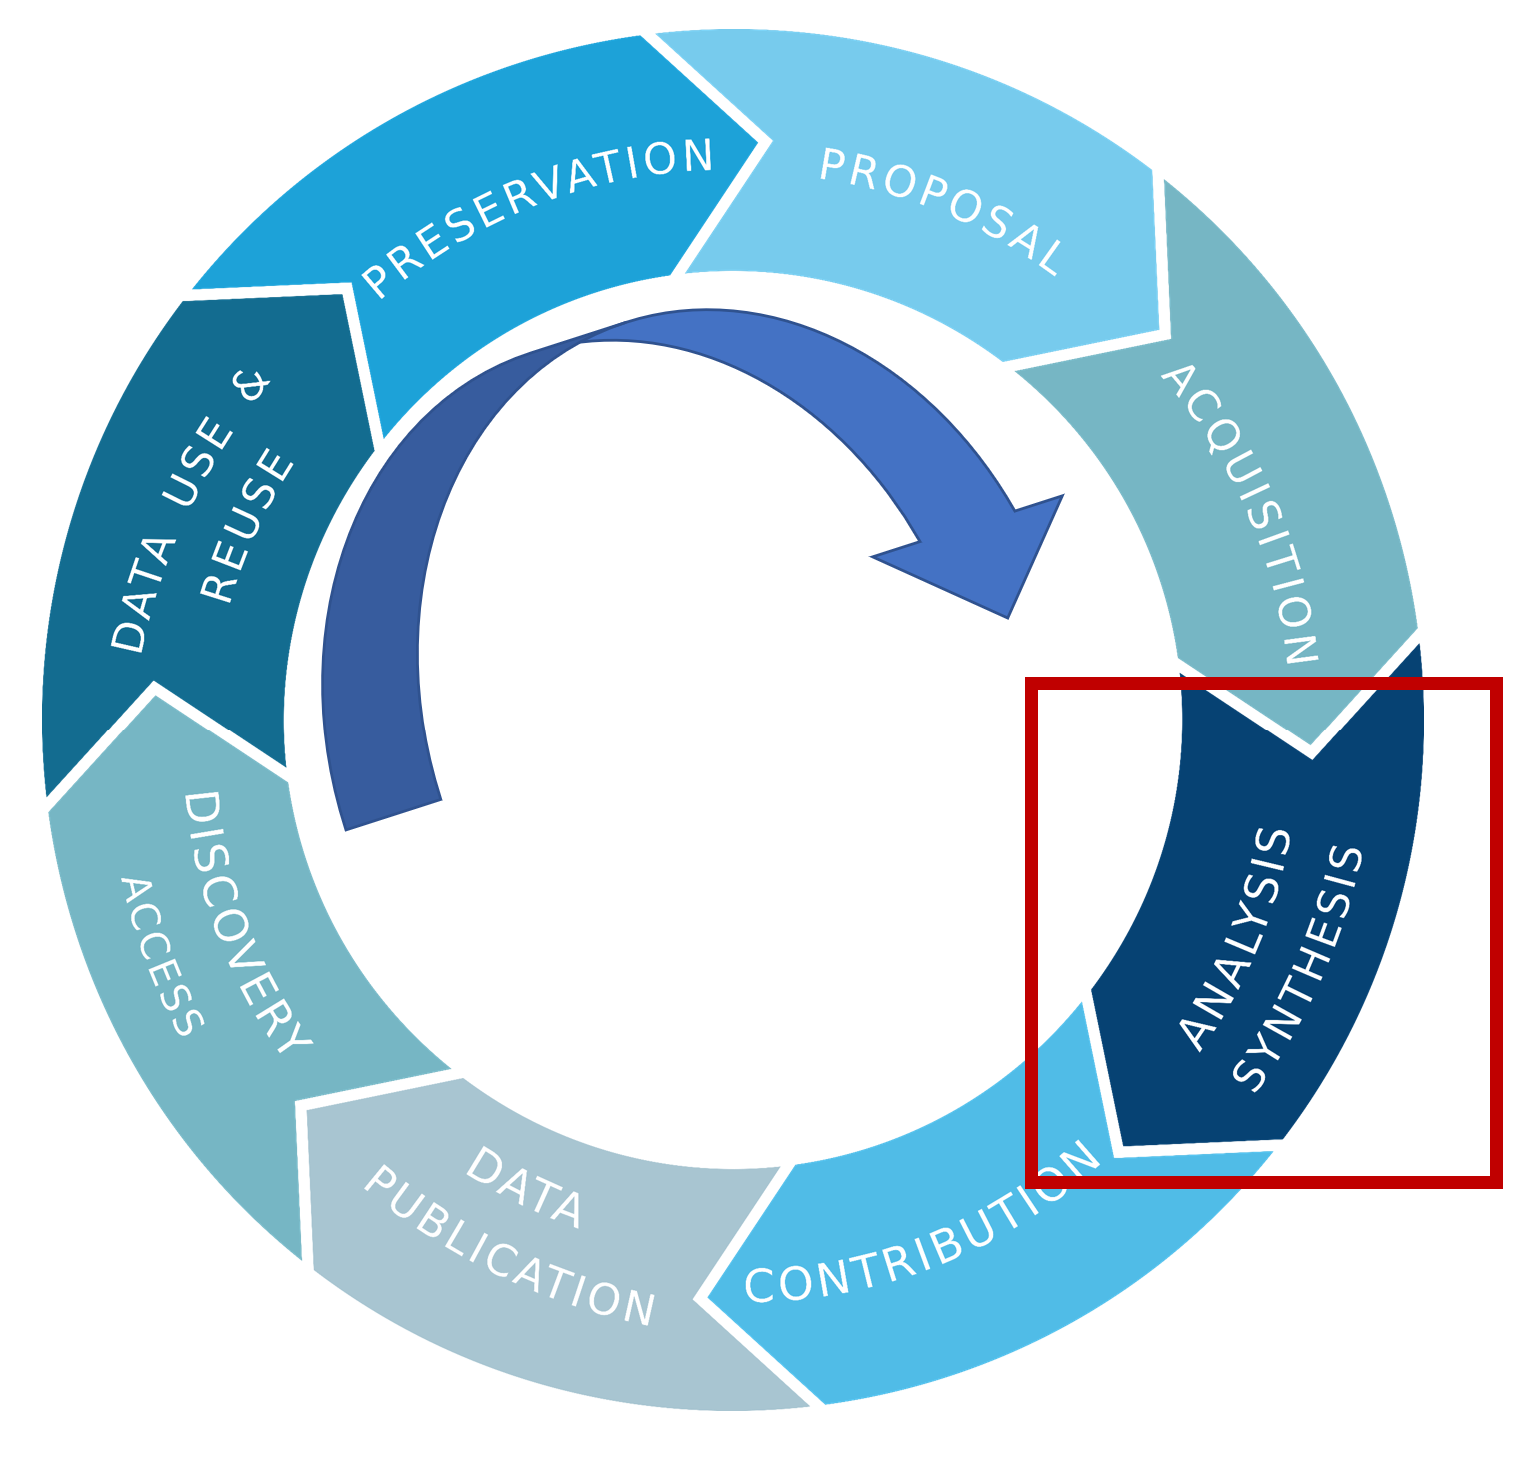
Where are we in the data life cycle?
Assessing a Dataset
It is a wonderful thing that so much data is free and available online. However, just because you can get it, does’t mean it can be used for your analysis.
You need to be a responsible and critical researcher and examine the metadata and data to make sure it is good quality data, and has the critical metadata you need to use it. You don’t want to start your analysis only to realize later that you don’t know the units of Oxygen in the data! You’d have to abandon ship and look for another dataset.
Take a look at the type of file the data is in. Do you have software that can load it?
Just because it is “Findable” that doesn’t mean it is FAIR data!
There are more letters in FAIR acronym other than F:Findable.
- There could be other barriers preventing your A:Access.
- It might not be in an I:Interoperable format you can use.
- It might not have the details you need like units, and therefore it isn’t R:Reusable.
Reviewing the metadata
Does the metadata include important context for using these data? Does it indicate anything about the data quality? Is it preliminary or final?
Look for any information about issues in the data. For example there may be a range of the data when a sensor was malfunctioning and the points were removed from the dataset. It will show up as a gap in the time series you may need to consider when calculating statistics.
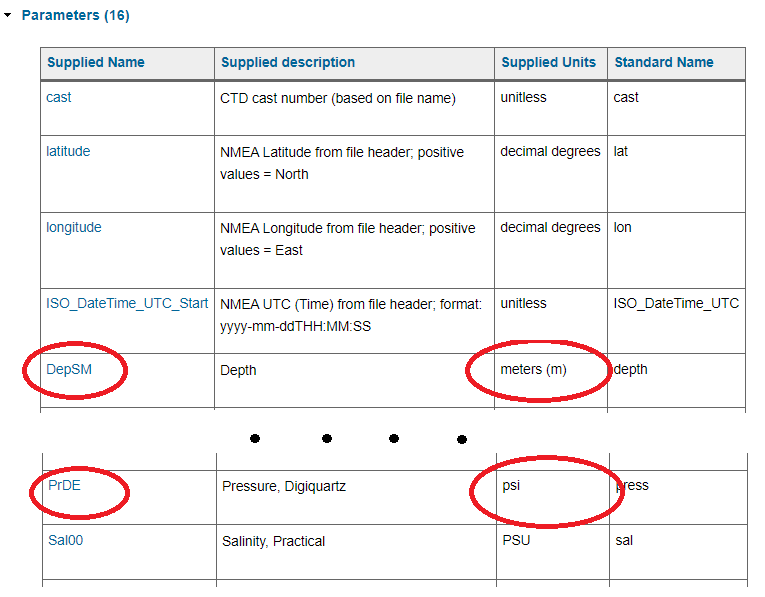
Can you find information about what is in each data column? What are the units?
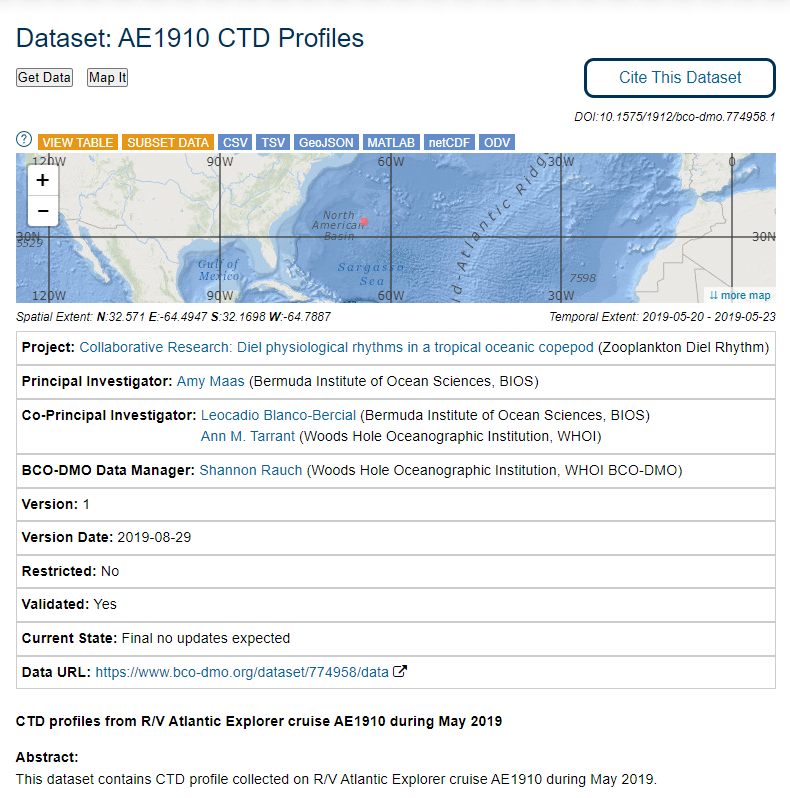
Example CTD Dataset Metadata Page at BCO-DMO
Dataset: AE1910 CTD Profiles: https://www.bco-dmo.org/dataset/774958
Exercise: Finding units
Go to Dataset: AE1910 CTD Profiles: https://www.bco-dmo.org/dataset/774958 which serves a data table.
Can you find which column(s) contain information about how deep the measurements were taken?
What are the column(s) names?
What are the units?
Solution
In the section called** “Parameters” **has this information.
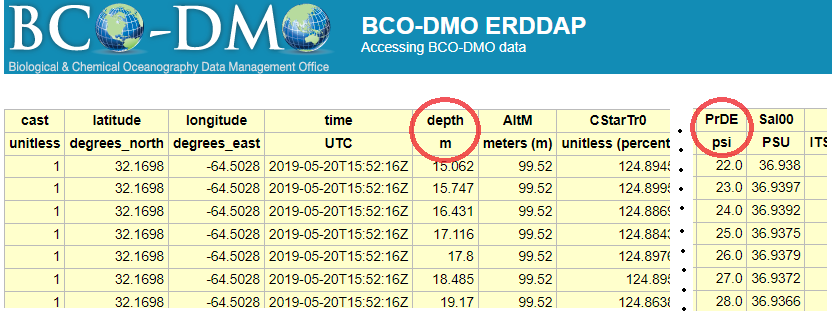
You can also see this information by viewing the data table with the button:
However since you don’t have descriptions of the columns here, it is best to get the information from the “Parameters” section as shown above.
Exercise: Looking at methods to understand your data
Go to Dataset: AE1910 CTD Profiles: https://www.bco-dmo.org/dataset/774958
Challenge question 1: What part of the cast is in this dataset?
These are CTD profiles (AKA “casts”) which are deployed over the side of a ship, go down through the water column, and back up again. We need to know which part of the profile we are working with. We could have data from the entire profile (up and down casts), or just the up cast, or just the downcast.
What part of the cast is in this dataset?
Challenge question 2: Raw or Processed?
It’s also important to know whether we are working with raw data directly off of an instrument, or whether it went through any processing. For CTD data it is standard to perform processing so we want to make sure we are working with processed not raw data.
Processing can include error correction, grouping data together by depth (AKA “binning”), and calculating new parameters (salinity and density can be calculated from temperature and conductivity).
What does the metadata say? Raw or processed data?
Solution
In the section called
Acquisition descriptionit says these data are from the up cast (not the down cast). In the section calledProcessing Descriptionit says these data were processed and binned to 1-meter intervals. This means that when we look at the data table we should see a row of data per atmosphere of pressure.
Key Points
Good data organization is the foundation of any research project.
BCO-DMO Data Access
Overview
Teaching: 10 min
Exercises: 5 minQuestions
How do I search for data in ERDDAP?
How can I subset a dataset?
How do I download a dataset?
Objectives
Downloading data with erddap
Downloading data using the dataset buttons
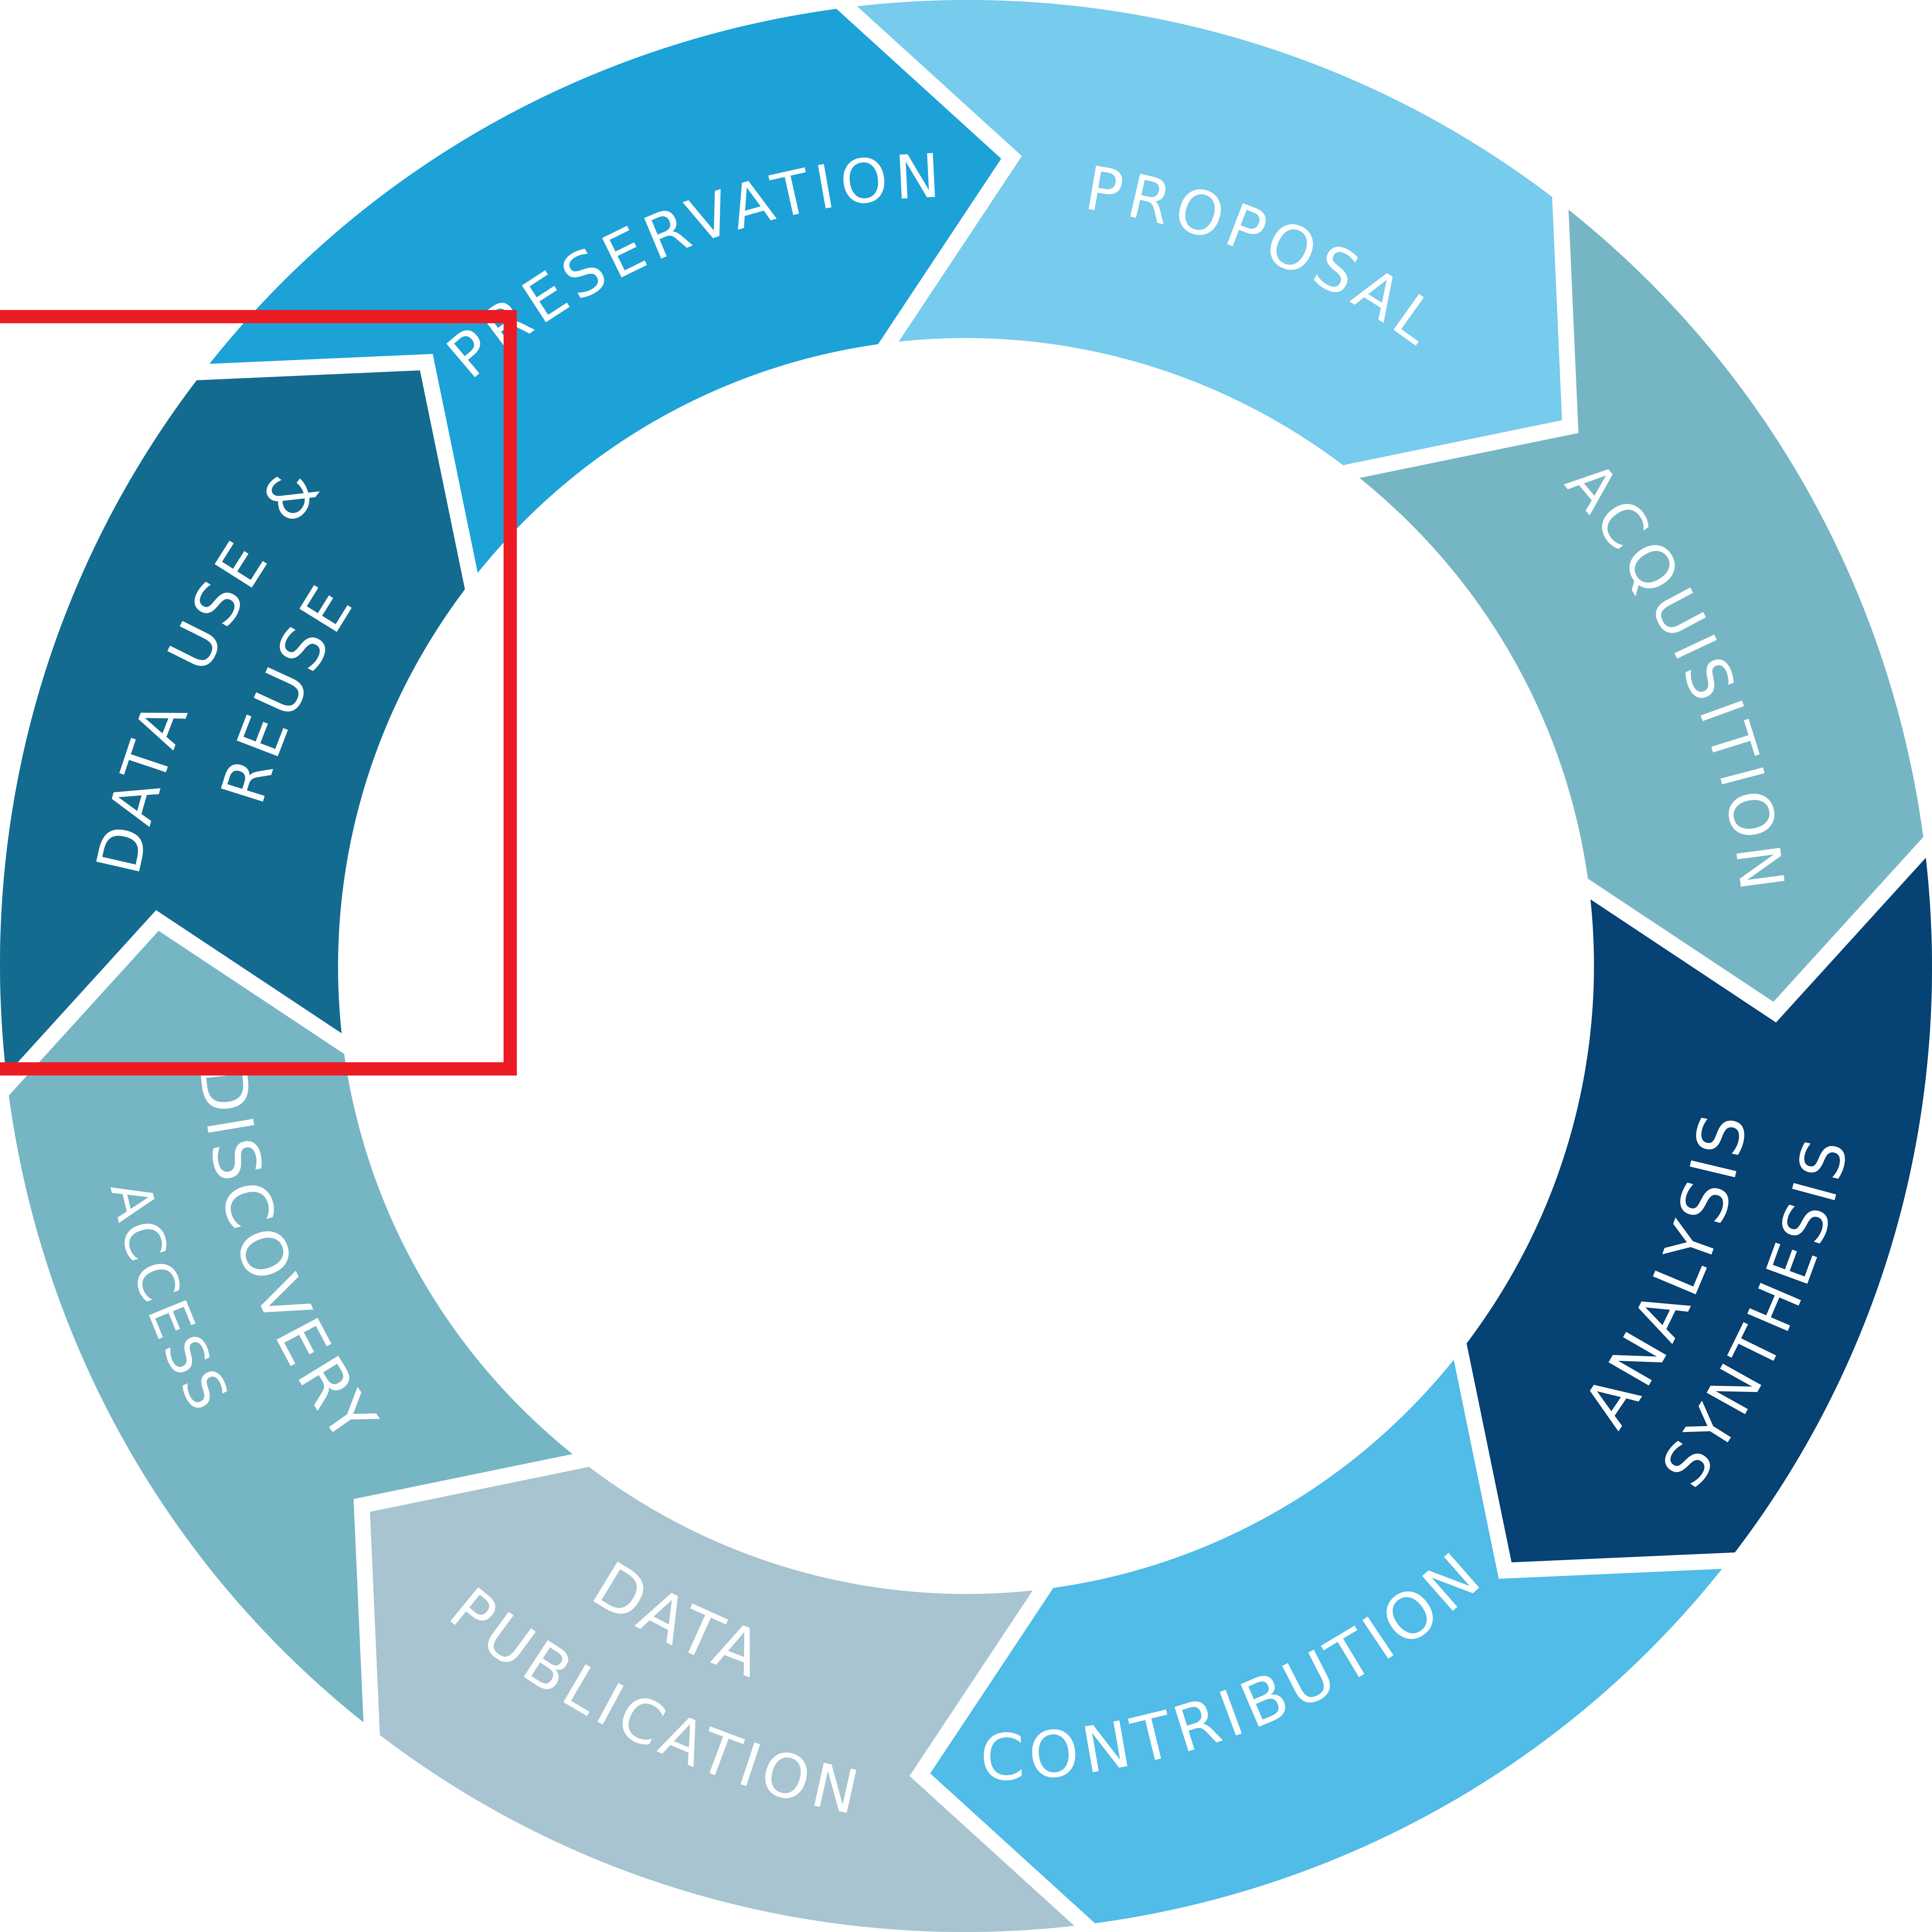
Where are we in the data life cycle?
What is ERDDAP?
When scientists make their data available online for people to re-use it, there can often still be barriers that stand in the way of easily doing so. Reusing data from another source is difficult:
- different way of requesting data
- different formats: you work with R while colleague is working with Matlab and the other one with python
- Need for standardized metadata
This is where ERDDAP comes in. It gives data providers the ability to, in a consistent way, download subsets of gridded and tabular scientific datasets in common file formats and make graphs and maps.
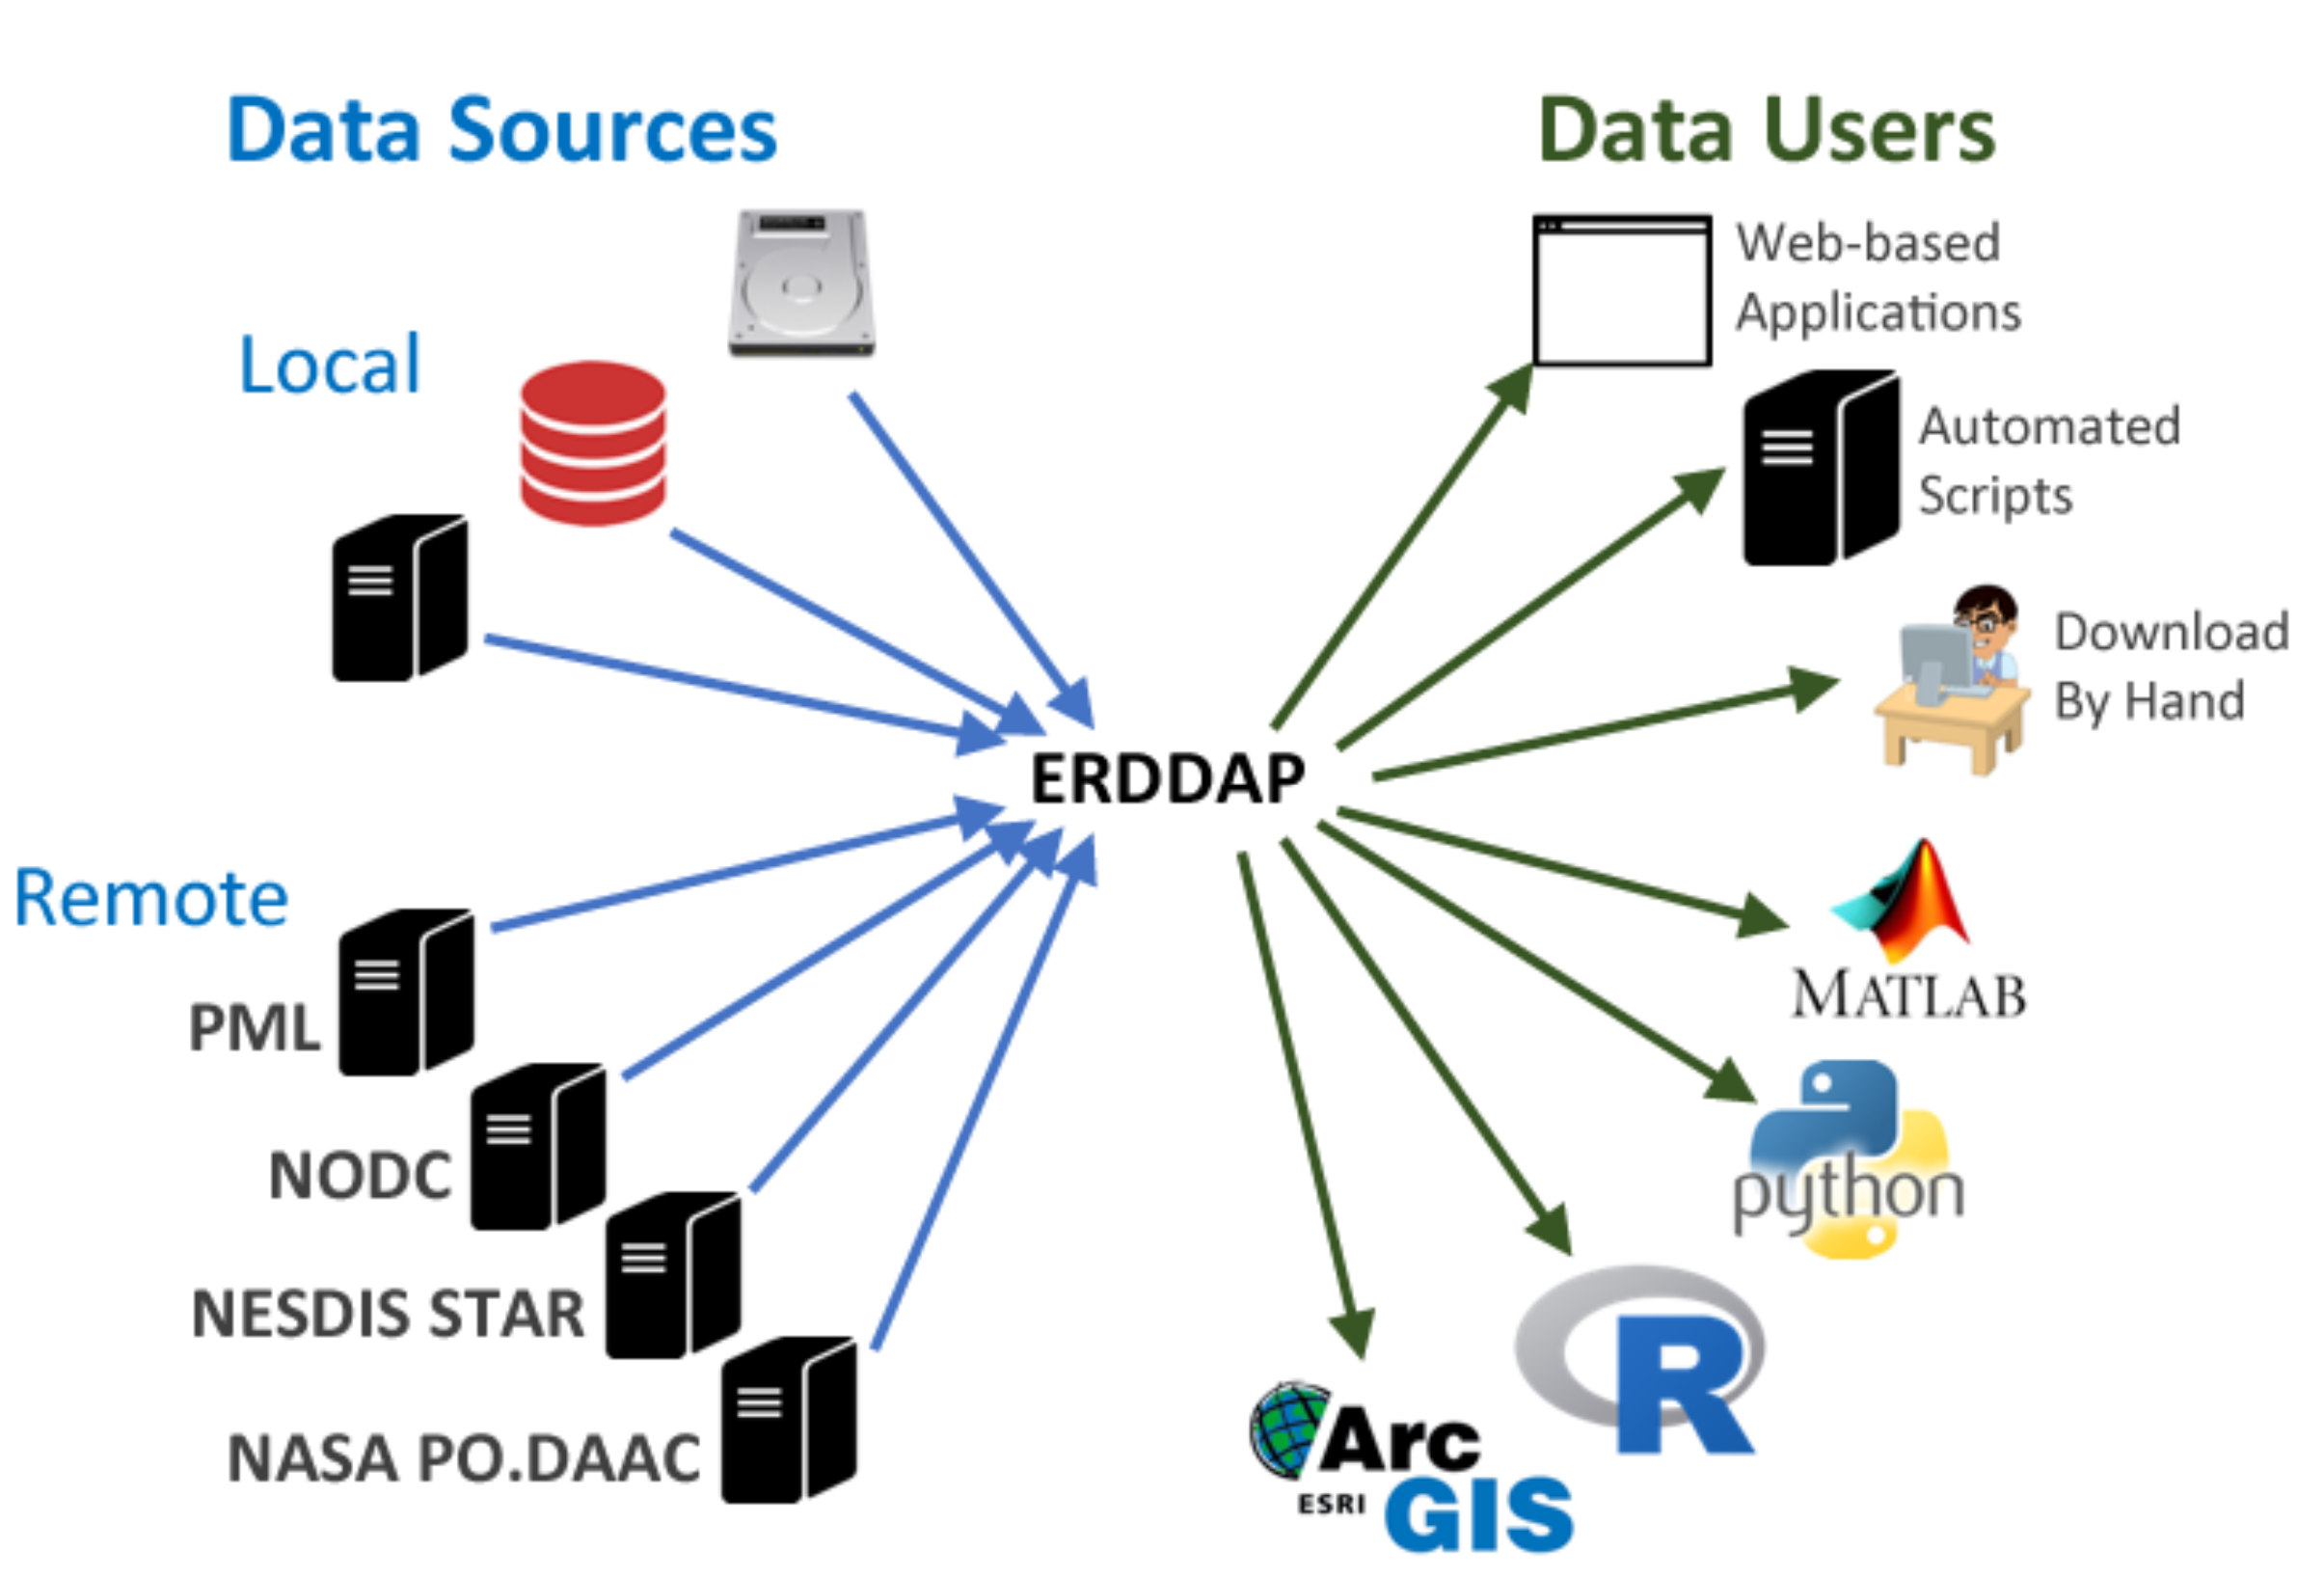
There is no “1 ERDDAP server”, instead organizations and repositories have their own ERDDAP server to distribute data to end users. These users can request data and get data out in various file formats. Many institutes, repo’s and organizations (including NOAA, NASA, and USGS) run ERDDAP servers to serve their data.
BCO-DMO has its own ERDDAP server that is continuously being updated. We added ERDDAP badges to make it easy for new users to grab the dataset in the format they need.
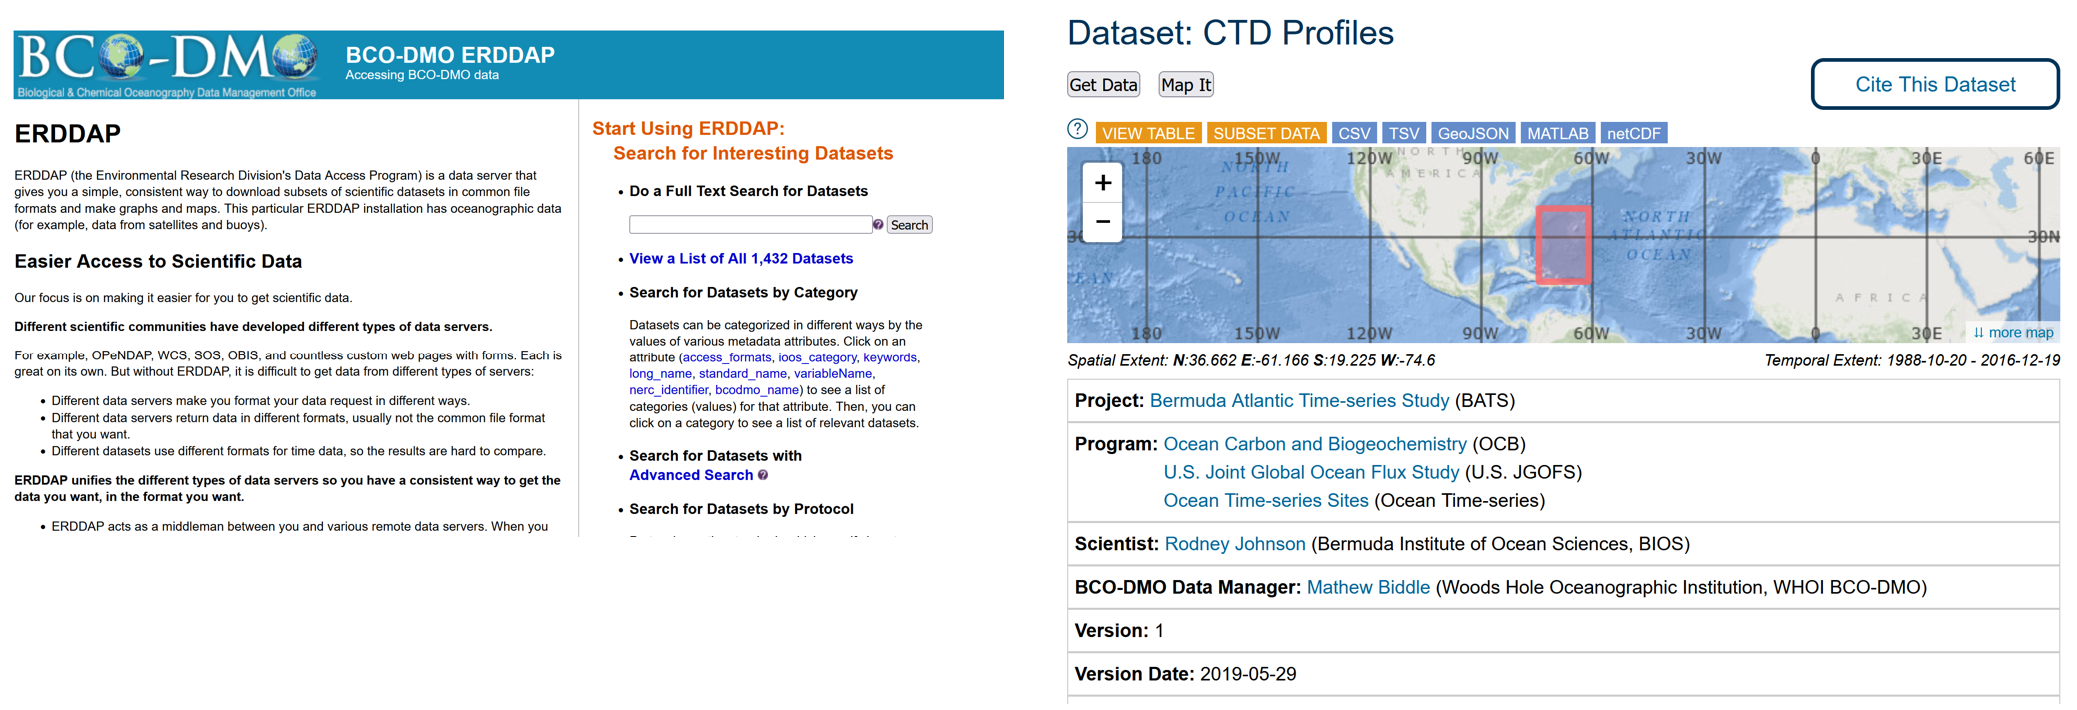
Downloading a Dataset
You can access data from the ERDDAP server, but you can also download a whole dataset from the Dataset Metadata Page itself. There are buttons to easily download data in many file formats. Dataset AE1910 CTD Profiles

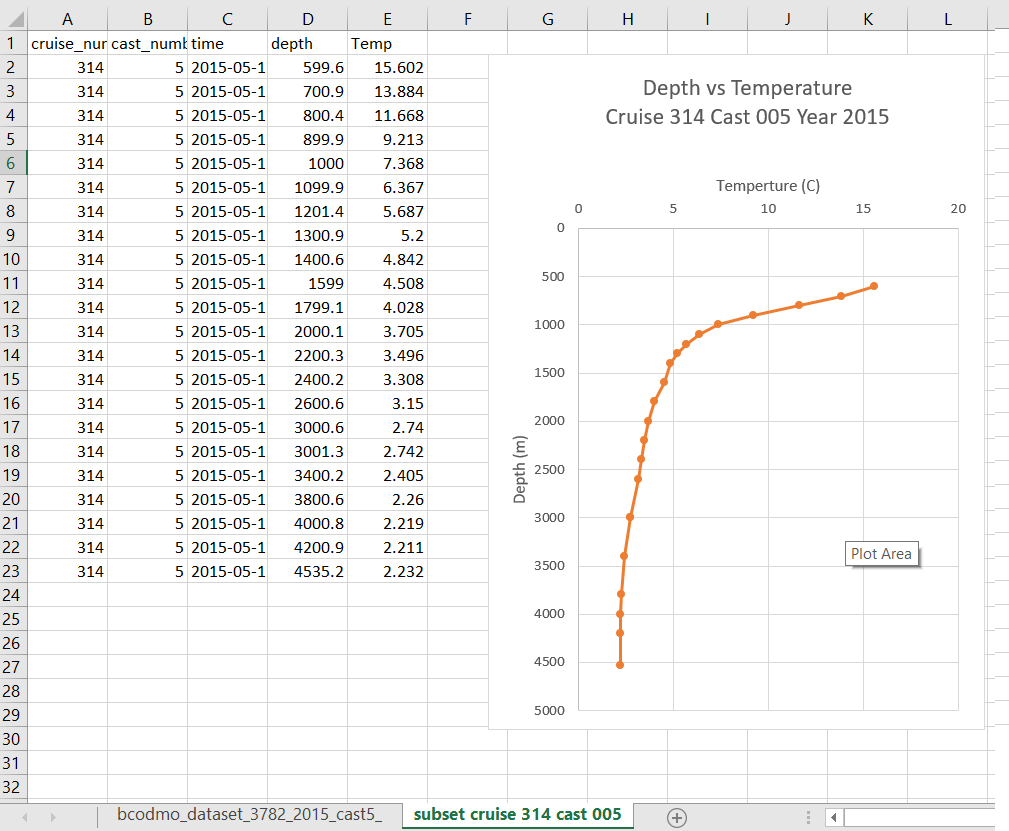
You can click the CSV button to download the data table in csv-format. You can then open it in the editor of your choice. Below is what it looks like in Excel.

- “Understand all the different factors for reusing online data with ERDDAP” keypoints:
- “Searching an ERDDAP data catalog can be done using a web page”
- “Data can be downloaded in different file formats”
- “Constraints can be added to a dataset search”
Subsetting Data
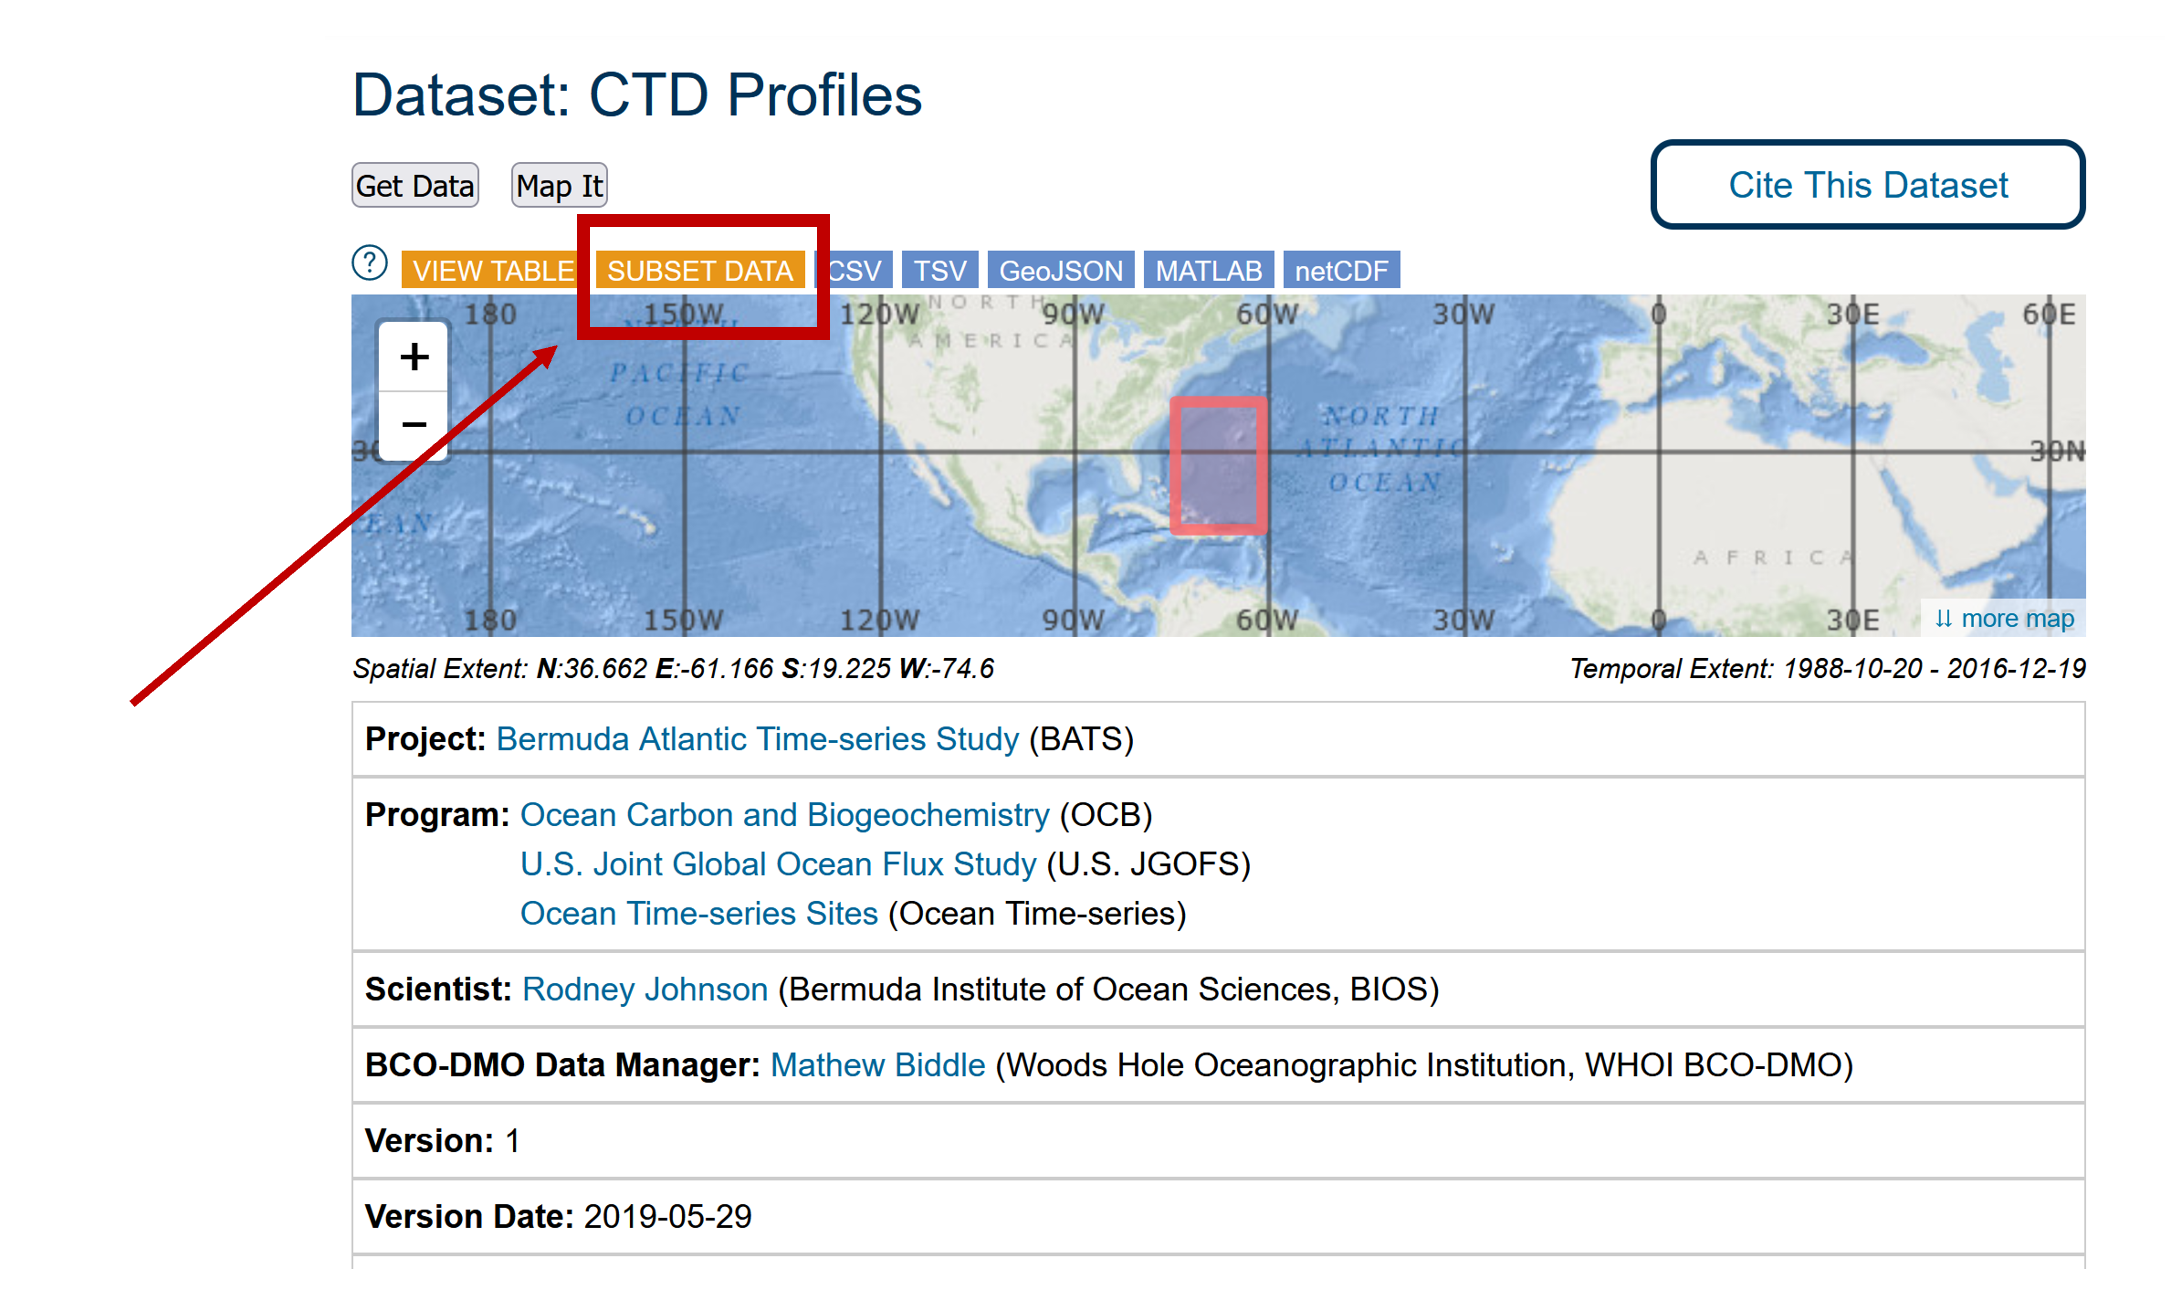
For this example, we’ll zoom in on the BATS CTD dataset that BCO-DMO is serving. The dataset landing page can be found here: https://www.bco-dmo.org/dataset/3918
This dataset has data from 1988 to 2016, so it is a very big dataset. Clicking on the “view table” button will try to pull up the data table, but it is very big and not easily to pull up and to download.

An easier way to download the data is to subset it. Which means taking a slice of the dataset that you are interested in in particular.
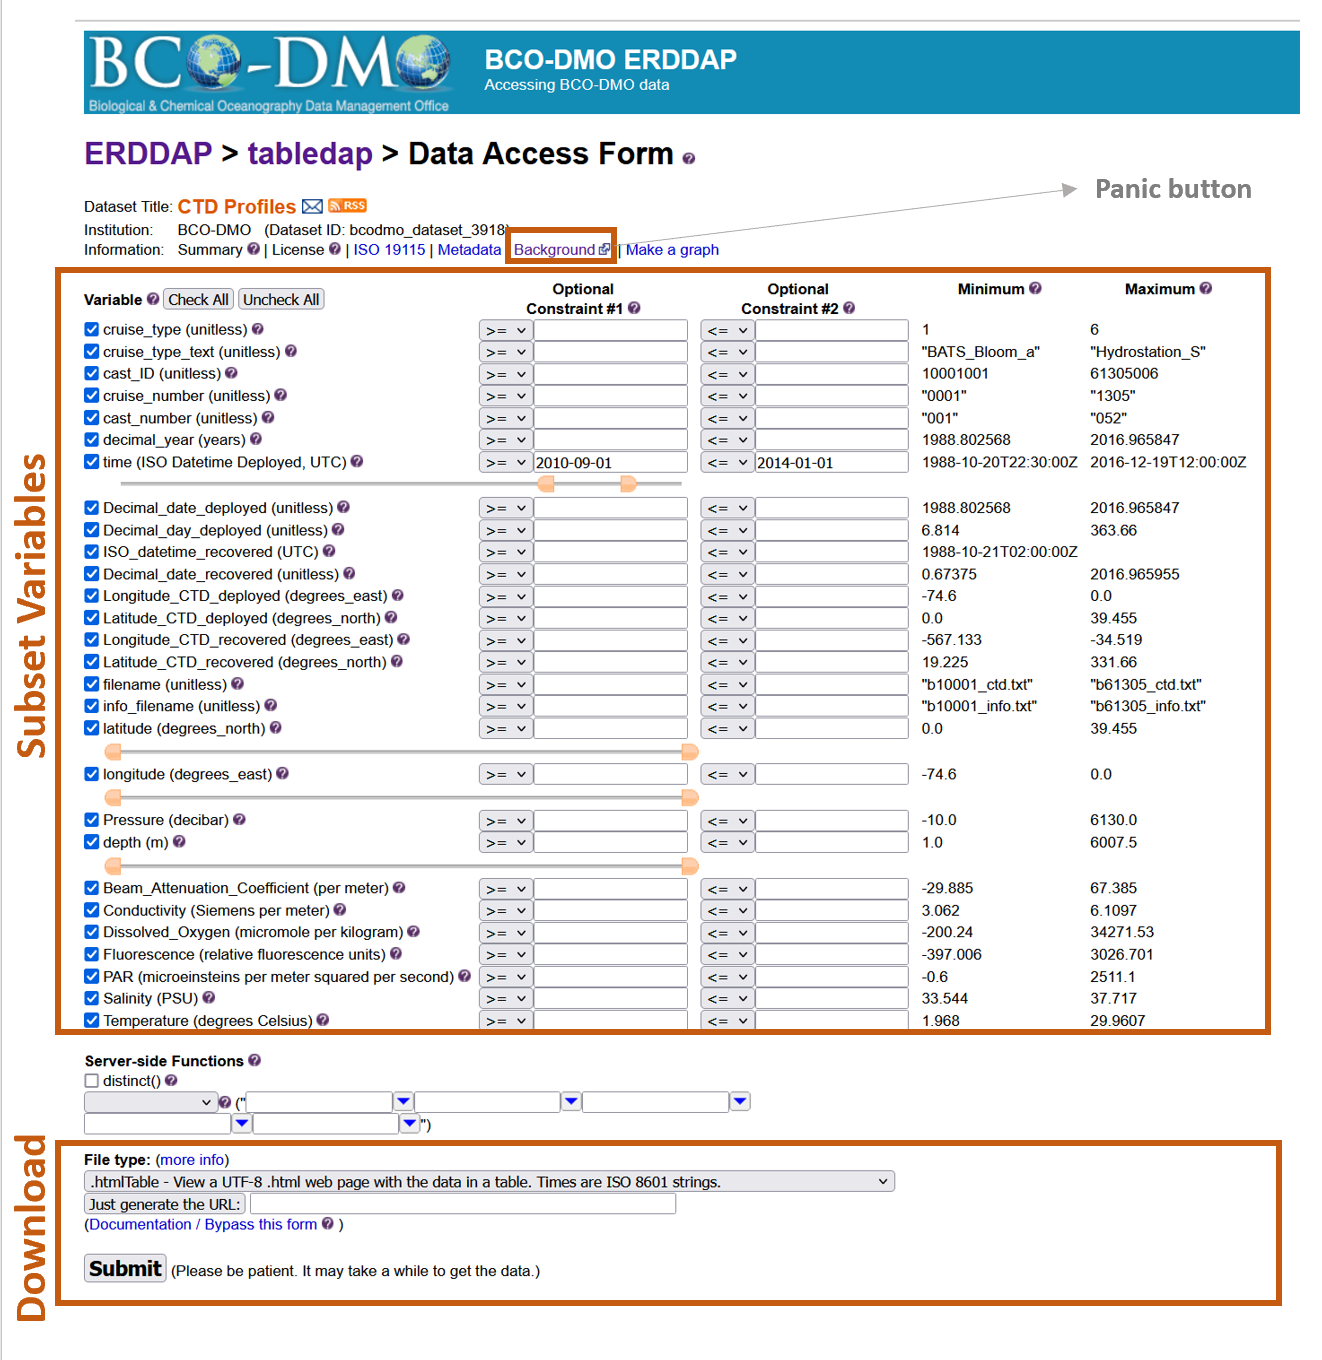
The ERDDAP subset page has 2 important parts:
- Subsetting variables: Here you can set which variables you want to download.
- “Download” part. Here you can choose from many different formats to download the datasets (and is the true power of ERDDAP). We will download the dataset in .csvp = 1 line of variables.
Key Points
Data can be downloaded in different file formats based in user needs
ERDDAP helps converting files to the needed format
Datasets can be subsetted for easier use
What is Data Provenance
Overview
Teaching: 20 min
Exercises: 0 minQuestions
What should I be recording while I do my analyses?
Objectives
Train yourself to record important metadata needed for
Where are we?
In the previous lesson we touched on capturing provenance and metadata while you clean your own dataset. But now we are talking about what you can do during the analysis phase of a data life cycle to implement FAIR practices.
What is Provenance?
Definition from Miriam-Webster Dictionary:
- Origin, Source.
- The history of ownership of a valued object or work of art or literature
Provenance was originally a term applied to works of fine art as a record of their history. It came to encompass not just chain of custody, but a full record of what happened to it and where it traveled. The term is now applied to data as well, and the meaning is the same. Where did a dataset come from? Who created it? What processing was done to it? Where was it stored?

The parallels between “artwork” and “data” still hold up today.
From “artworkarchive’s “Provenance 101”:
- “An ideal provenance captures the ownership history of an artwork all the way back to the creation of the artist. But, many times there are gaps in the object’s ownership record which can affect the work’s value. “
- _ “Don’t make your artworks worthless by losing important information. “_
Have you ever come back to plots or data you created and have no idea how you make them? At that point the provenance is gone. You can’t go back in time and collect some kinds of metadata. You have to keep good notes and records while you work with your data.
What to keep in mind when writing a provenance record
- Document where you get your source data so you can cite it later. If you collected it yourself, make sure you have all the metadata about how, when, and where you collected it. Keep notes about what processing you do to the data.
- Keep your source data separate from your analysis tables. Never manipulate your source data during your analyses! Make a separate copy for manipulating however you need to during the analyses. Make a system to keep track of your workflow and identify different data tables. This can be a formal version control system (e.g. git/github) or a documented plan for folder and file naming conventions along with notes.
- Write notes like you are explaining it to someone else. Look at your plots and data and pretend you are stepping someone else through how you would produce the same thing. Even if you come back to it yourself in the future, it’s likely you would have forgotten all the details. Help yourself out with good documentation.
- Record the filename and path you save to. Make it clear what was done to produce each file.
Example notes:
2022-06-22: Downloaded a subset of dataset “Niskin bottle samples” which spans 2004 to 2008 to folder “BATS_niskin/orig/bcodmo_dataset_3782_2004_to_2008.csv”
data source citation: Johnson, R. (2019) Niskin bottle water samples and CTD measurements at water sample depths collected at Bermuda Atlantic Time-Series sites in the Sargasso Sea ongoing from 1955-01-29 (BATS project). Biological and Chemical Oceanography Data Management Office (BCO-DMO). (Version 1) Version Date 2019-05-29 [Subset 2004 to 2008]. http://lod.bco-dmo.org/id/dataset/3782 [Accessed on 2022-06-22]
Data were binned data by hour, ordered table by station, cast, pressure and saved to “BATS_niskin_2004_to_2008/hourly/BATS_niskin_hourly.xlsx”
- exported Sheet 1 to “BATS_niskin_2004_to_2008/hourly/BATS_niskin_hourly.csv.”
- exported plot in Sheet 2 to “BATS_niskin_2004_to_2008/hourly/BATS_profiles.png”
Having clear records about how a plot was produced with the table you used to produce it is very important for reports and journal publications. It allows your results to be reproducible, transparent, and facilitate peer review. It also makes writing your publication easier since you already have the figure captions written!
Key Points
You can’t go back in time and collect some kinds of metadata. You have to keep good notes and records.
Provenance Walkthrough
Overview
Teaching: 5 min
Exercises: 0 minQuestions
Provenance capture walkthrough. Download a dataset, write provenance during analysis
Live Demo: Download a dataset, write provenance during analysis.
- Subset dataset “Niskin bottle samples” https://www.bco-dmo.org/dataset/3782
- Click the
Subset Databutton at the top of the page.- Download a subset of this dataset containing cruise 314, cast 005.
- Open a text editor and write down every step you take. Make sure to write the date you are handling the data.
Solution
You can use this link to download the subset of data for the exercise from BCODMO: OR you can download the csv file from this lesson
Next steps
- Make a new sheet for the data you change during your analysis.
- Invert the depth axis since depth of 0 is the surface.
Anyone can create metadata
You don’t need any special skills to write metadata and documentation to keep track of your provenance.
However, there are specifications and tools you can learn that have huge benefits. See more about metadata specifications like PROV.
Version control (e.g. git/github) is a great way to keep track of all the changes in your files. It does have a learning curve but will save you time and frustration in the long run after you learn it.
I’m sure everyone has experienced this frustration:
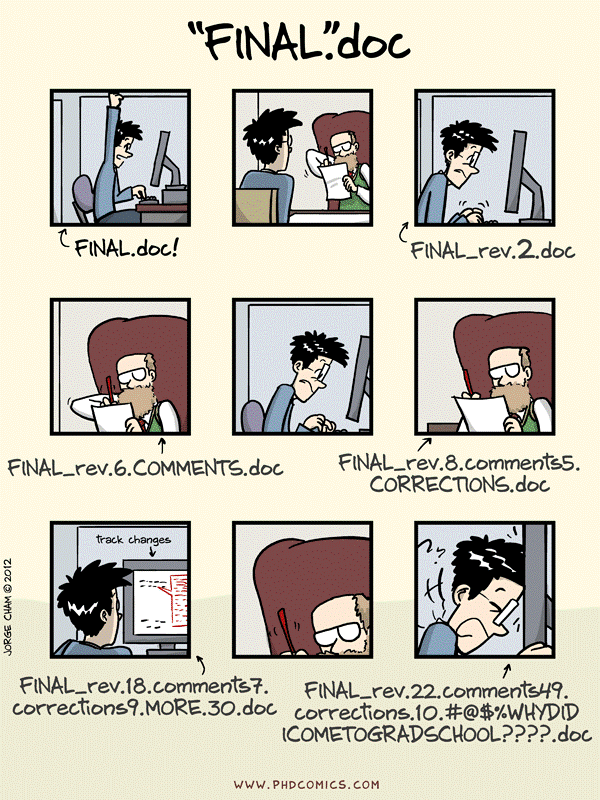
from: Wit and wisdom from Jorge Cham (http://phdcomics.com/)
Git will keeps track of all the differences in your files over time, no need to keep a million copies! You can make notes for each version of your files too.
Learn more about Version Control and Git in a Software Carpentry.
Open new doors with a programming language
Like version control, learning a programming language has a learning curve. But the benefits after you learn it will be substantial. It will open up a lot of doors for your current research, and you will have a valuable skill that is in demand in many fields including research.
There are many resources online for learning a programming language, but you can check out the “Software Carpentry” lessons which https://software-carpentry.org/lessons/
Python Example
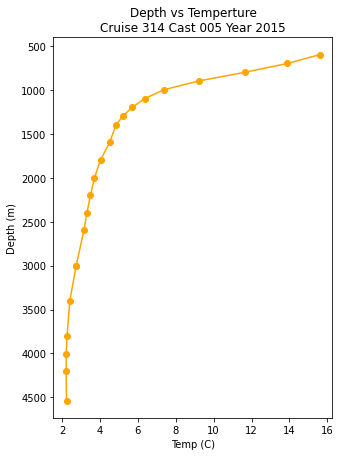
An example python notebook that is fully reproducible that does the exact same thing we just did manually to create that plot. BATS niskin subset example notebook And my text.
Key Points
Provenance should be captured while you work with your data.
Practice provenance
Overview
Teaching: 10 min
Exercises: 40 minQuestions
Practice provenance capture. Download a dataset, write provenance during analysis
Exercise: Download a dataset, write provenance during analysis.
Step 1: BCO-DMO datasets to choose from:
- Underway Chlorophyll: https://www.bco-dmo.org/dataset/817214
- Sponge density, morphology, benthos percent cover: https://www.bco-dmo.org/dataset/814267
- MOCNESS data: https://www.bco-dmo.org/dataset/713636
Step 2:
- Download a dataset
- Make a plot of parameters of choice.
- Write down the provenance of your analysis
Key Points
some keypoint
