Assessing Datasets for Reuse
Overview
Teaching: 15 min
Exercises: 10 minQuestions
How do you assess datasets to make sure they are ready for analyses?
How do you download the dataset you choose?
How do you plot and explore data?”
Objectives
Practice best practices for manipulating and analyzing data. Learn what to look for in metadata to make sure a dataset is ready for analysis.
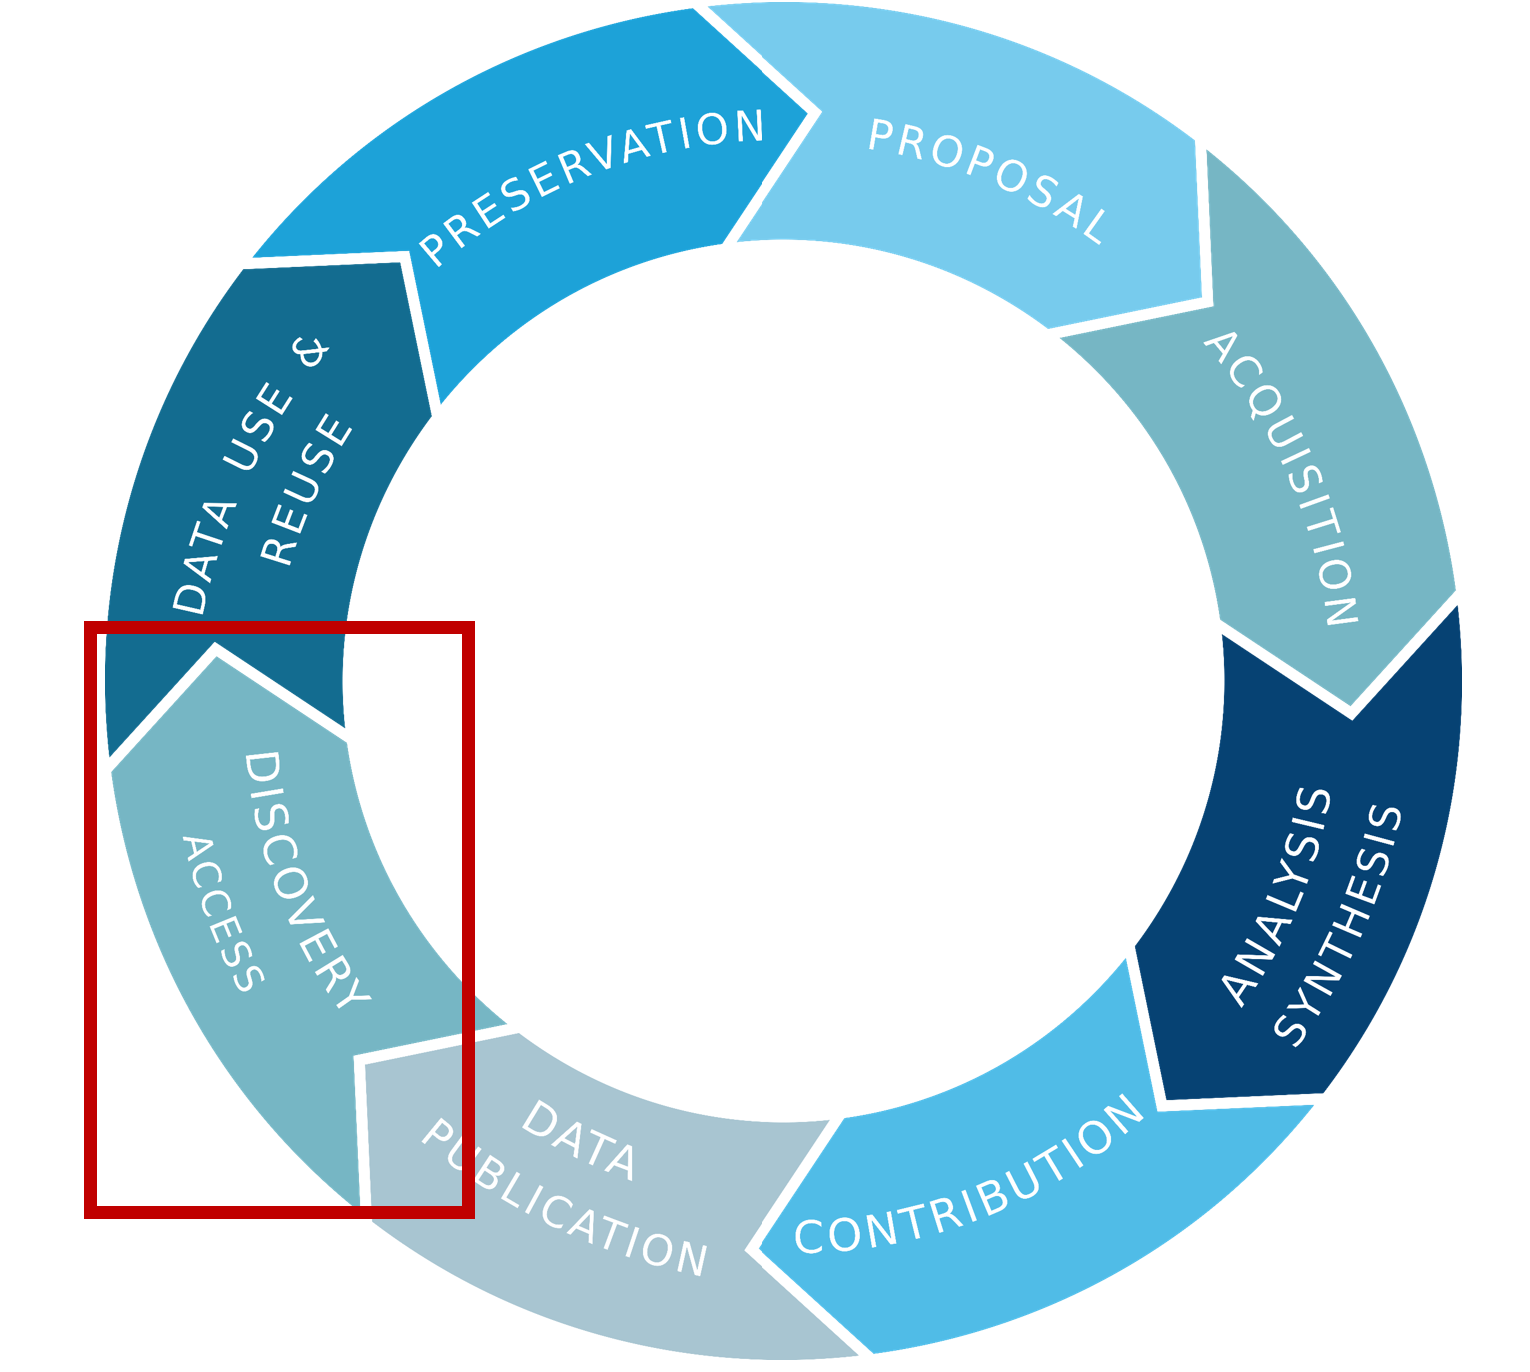
Where are we in the data life cycle?

Assessing a Dataset
It is a wonderful thing that so much data is free and available online. However, just because you can get it, does’t mean it can be used for your analysis.
You need to be a responsible and critical researcher and examine the metadata and data to make sure it is good quality data, and has the critical metadata you need to use it. You don’t want to start your analysis only to realize later that you don’t know the units of Oxygen in the data! You’d have to abandon ship and look for another dataset.
Take a look at the type of file the data is in. Do you have software that can load it?
Just because it is “Findable” that doesn’t mean it is FAIR data!
There are more letters in FAIR acronym other than F:Findable.
- There could be other barriers preventing your A:Access.
- It might not be in an I:Interoperable format you can use.
- It might not have the details you need like units, and therefore it isn’t R:Reusable.
Reviewing the metadata
Does the metadata include important context for using these data? Does it indicate anything about the data quality? Is it preliminary or final?
Look for any information about issues in the data. For example there may be a range of the data when a sensor was malfunctioning and the points were removed from the dataset. It will show up as a gap in the time series you may need to consider when calculating statistics.
Can you find information about what is in each data column? What are the units?
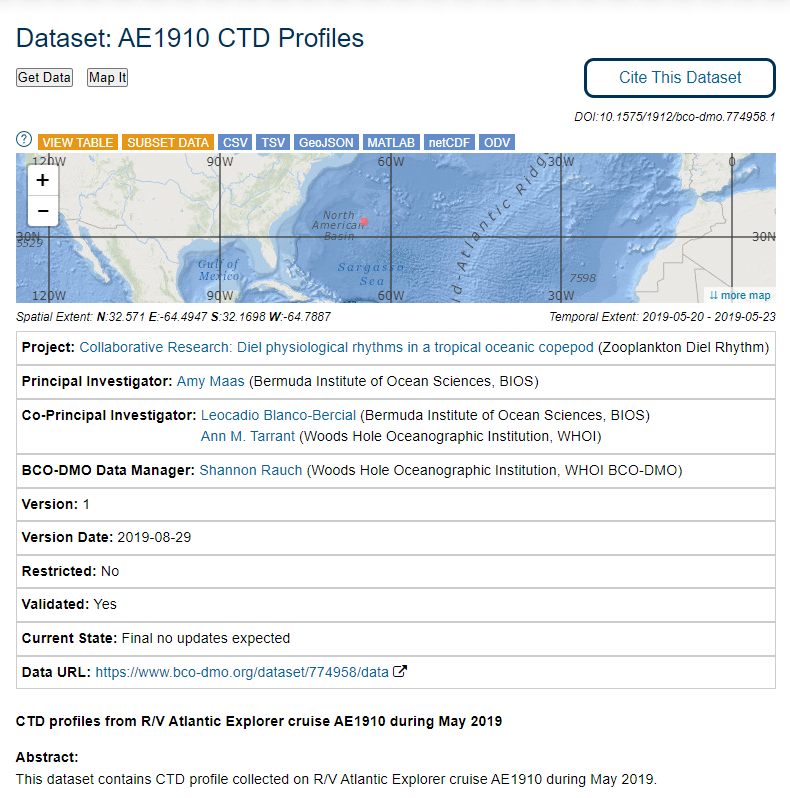
Example CTD Dataset Metadata Page at BCO-DMO
Dataset: AE1910 CTD Profiles: https://www.bco-dmo.org/dataset/774958

Exercise: Finding units
Go to Dataset: AE1910 CTD Profiles: https://www.bco-dmo.org/dataset/774958 which serves a data table.
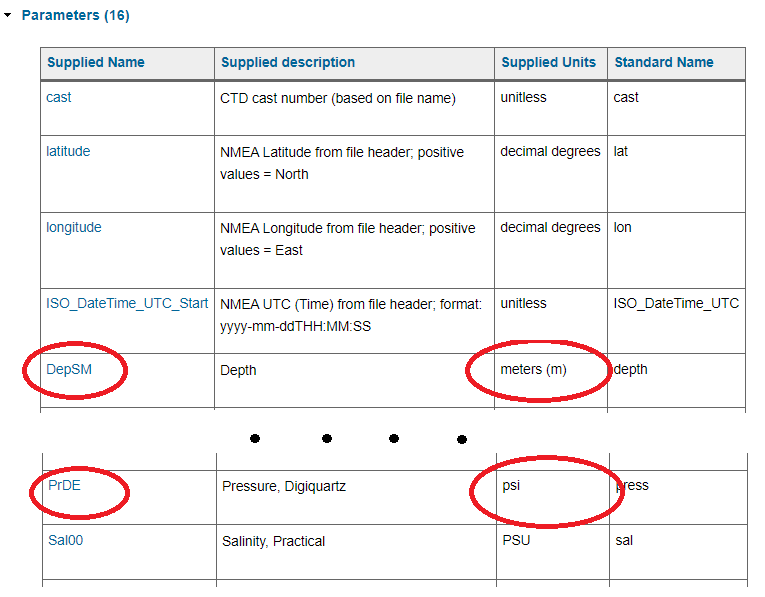
Can you find which column(s) contain information about how deep the measurements were taken?
What are the column(s) names?
What are the units?
Solution
In the section called** “Parameters” **has this information.
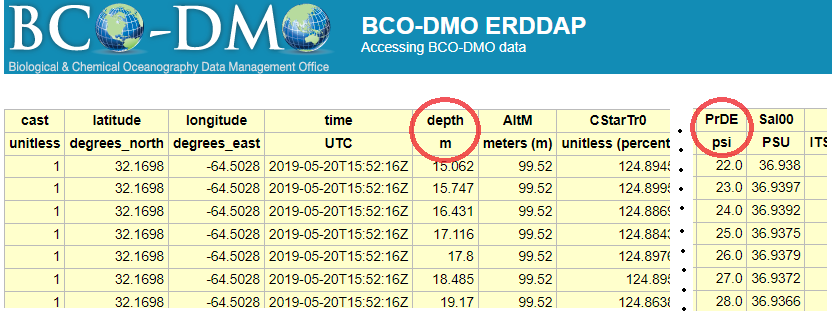
You can also see this information by viewing the data table with the button:
However since you don’t have descriptions of the columns here, it is best to get the information from the “Parameters” section as shown above.
Exercise: Looking at methods to understand your data
Go to Dataset: AE1910 CTD Profiles: https://www.bco-dmo.org/dataset/774958
Challenge question 1: What part of the cast is in this dataset?
These are CTD profiles (AKA “casts”) which are deployed over the side of a ship, go down through the water column, and back up again. We need to know which part of the profile we are working with. We could have data from the entire profile (up and down casts), or just the up cast, or just the downcast.
What part of the cast is in this dataset?
Challenge question 2: Raw or Processed?
It’s also important to know whether we are working with raw data directly off of an instrument, or whether it went through any processing. For CTD data it is standard to perform processing so we want to make sure we are working with processed not raw data.
Processing can include error correction, grouping data together by depth (AKA “binning”), and calculating new parameters (salinity and density can be calculated from temperature and conductivity).
What does the metadata say? Raw or processed data?
Solution
In the section called
Acquisition descriptionit says these data are from the up cast (not the down cast). In the section calledProcessing Descriptionit says these data were processed and binned to 1-meter intervals. This means that when we look at the data table we should see a row of data per atmosphere of pressure.
Key Points
Good data organization is the foundation of any research project.


